Introduction
Few people know it, but before becoming a Hollywood blockbuster staring Leonardo DiCaprio and Kate Winslet, Titanic was well known as an actual british passenger liner from the early XXth century.
Just kidding…
The Titanic and its tragic fate are known to all as one of the most famous civil shipwreck in history.
Leaving Southampton in Great Britain on 10th April 1912, it hit an iceberg 4 days later and sunk on 15th April. On board were more than 3300 passengers (exact number varies according to sources), including nearly 900 crew members.
On board there were only 20 lifeboats, sufficient for 1178 people, so about a third of the total number of passengers. There was an estimate of 705 survivors.
In this project we aim at studying features of passengers such as their age, sex, class, ticket price (fare), port of embarkments, number of family members of board etc, and to predict whether the passenger survived or not.
Method
We built several prediction models using various classification algorithms. Each model was trained with a subset of the passengers obtained on Kaggle, a data science contest website.
We then tested the model with another subset of the passengers and compared our survival predictions with actual survival. Each time we checked various criteria:
- Accuracy: the proportion of right predictions
- Precision: out of all predicted survivors, how many were actual survivors
- Recall: out of all survivors, how many did indeed predict as survivors
Finally, after comparing our models with this test set, we run a final check using a validation set (again another subset of the passengers that we didn’t use before). This gave us a final confirmation of our best model.
Results
Here are the algorithms we tried and the precision/recall for test set, and accuracy they achieved using the validation set:
| Algorithm | Precision (test) | Recall (test) | Accuracy(validation) |
|---|---|---|---|
| Logistic Regression | 78% | 57% | 77% |
| K Nearest Neighbours | 64% | 62% | 64% |
| Decision Tree | 77% | 60% | 78% |
| Bagging | 72% | 63% | 50% |
Interpretation
The result show clear superiority of Logitic Regression and Decision Trees over KNN and Bagging, as they yield much better results for all criteria.
However there is not obvious reason to prefer Logistic Regression over Decision Tree or vice versa. The former will be slightly better at being right when predicting that someone survived, whereas the latter will be better at identifying the highest ratio of survivors. Depending on what from wrongly predicted survival or lower ratio of actual surivors identified we want to favour when predicting, we may chose one or another.
Looking into classification trees in more details
One of the drawbacks of machine learning algorithms is that they are often hard (if not impossible) to interpret. Fortunately decision trees can be displayed in a graphical format that can be easily understood.
Here is what it looks like in our case:
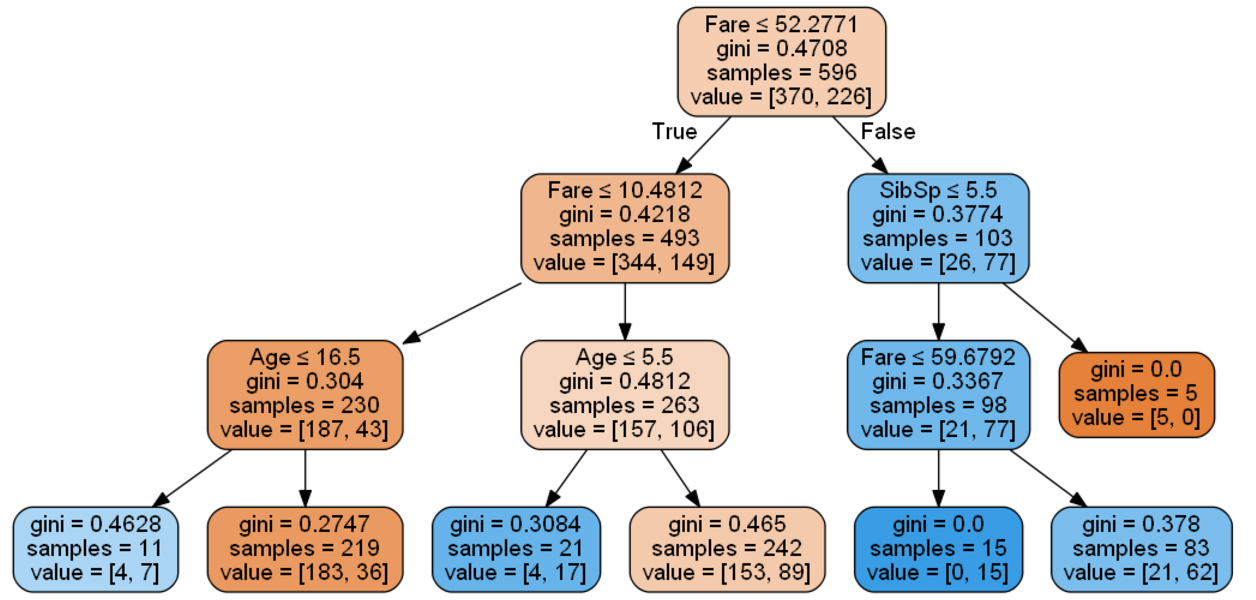
How to read this tree?
Start from the top. The top box tell you that in our training dataset, 370 died and 226 survived. Now the main differenciator was the fare that people paid. If they paid less than $52, then follow to the next box below on the left. If they paid more than $52, then follow to the next box below on the right.
Let’s focus on this last box. Out of those who paid more than $52, 77 survived and 26 died. That’s quite an impressive ratio of 75% survival!
Yet if you look at those who paid less than $52, 149 survived and 344 died. That’s only a 30% survival rate.
What this tells us is that if you paid a higher fare, you had many more chances to survive. Ok, fair enough, nothing groundbreaking, those who watched the movie knew already!
But you can continue analysing the next boxes to understand what impacted chances of survival. I won’t go into details, but you will see that the main determinants identified by the model are fare and age (looks like children had a better survival rate, apparently the rule “women and children first” prevailed). Number of siblings also appears in the tree but only for 5 individuals, so it may not be so relevant.
Conclusion
Our study has shown that with a limited set of information about Titanic passengers, we were able to predict with an accuracy of 78% whether they survived or not the shipwreck.
Out of 4 algorithms studied, 2 have been ruled out due to poor performances, and 2 have been retained and can be used based on the type of results we want to achieve:
- Logistic regression tends to be better at predicting that someone survived if he actually survived
- Decision tree tends to be better at capturing the highest proportion of survivors