About billboard
To many, music is an art, a great source of pleasure, a way to relax.
But of course for majors producing artists, retailers either physical or online, and sometimes for artists themselves, music is mostly a business.
Since 1958, the billboard magazine establishes the so called “billboard hot 100” ranking of the top 100 best selling and most broadcasted singles for a given week.
This ranking is obviously closely watched by all stakeholders of the music industry, either to assess how successful they are as artists, which artist’s albums should be purchased to refurbish the stocks and put on the shelves, which song to broadcast on a more frequent basis or on which artist to spend more for future promotion campains.
What do successful singles have in common?
Since music is as much an industry as an art, we may wonder what most successful songs, i.e. those reaching the top of the charts, have in common. In this post we will only focus on “meta data”, i.e. information we can gather about the songs without considering at all the musical side of things.
For this purpose, we will examine a dataset containing the charts for year 2000. It contains the track name, the artist name, the song duration, the genre, the week it entered the charts, the week it reached its peak position, as well as the position for each week from the time it entered the charts until the week before it exited it.
Some of the questions we may want to answer are:
- is there a particular length that most succesful songs have in common?
- is there a particular month best suited to enter the charts to reach the top position?
- how long do songs remain at the top of the charts?
- how long do songs remain in the charts, regardless of their ranking?
- how long does it take for a song to reach its peak ranking?
In the remainder of this article, we will be searching for answers to these questions
Is there a particular length that most succesful songs have in common?
Let’s compare the distribution of the song duration for #1 songs and all billboard songs

What this graph shows is that the distribution of the song length, either #1 or all billboard is approximately the same, with a median of 240 seconds, i.e. 4 minutes. In other words there are as many songs that last less than 4 minutes than songs than last more. And most songs are quite concentrated around that value.
However there is a big no-no for a song that want to make it to the top of the charts: it shouldn’t last more than 270 seconds.
One interpretation we can make of this fact is that if a song is too long, it won’t be broadcasted as often as broadcasting time is limited. It will therefore reduce its chances to be heard often and sell more.
Is there a particular month best suited to enter the charts to reach the top position?
Let’s look at the distribution of top ranking reached for each song by month it entered the charts.
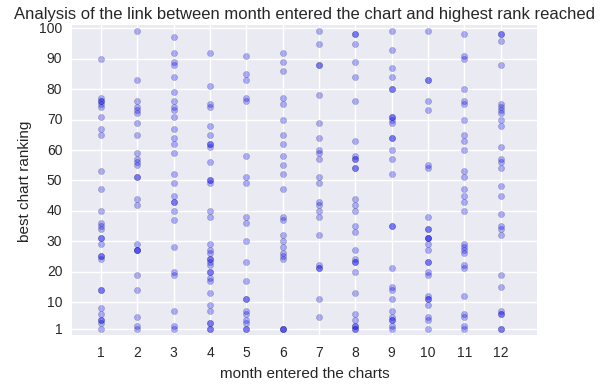
How to read this chart: let’s take month 6 (June): it shows that for the songs that entered the billboard on that month, they either made it to the top at some point (for 3 of them, based on the point darkness) or they didn’t make any better than 24 (as all other points are situated above the value 24 on y axis)
Any general interpretation of this graph is risky: there is too few data to be able to draw conclusions. However looking at similar data for multiple years may help give an idea of when it is best to launch a song on the market. Typically many record companies launch new albums from top selling artists early December to benefit from the Christmas/year end celebration sales boost.
How long do songs remain at the top of the charts?
Let’s look at the distribution of how long songs remain #1.
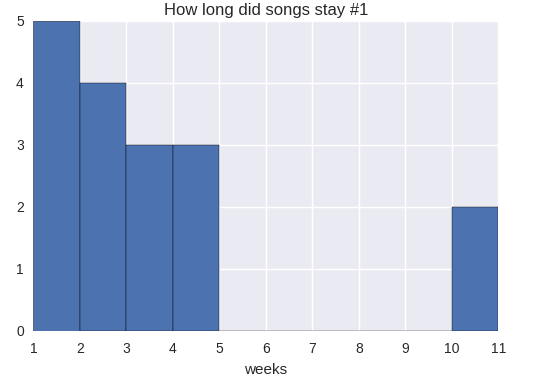
As expected, as hard as it may be reaching the top of the charts with only 17 songs making it in 2000, staying there is even harder. We observe a decline, with 5 songs staying at the top 1 week only, 4 staying 2 weeks, 3 staying 3 weeks and also 3 staying 4 weeks.
But there is a surprise with two songs staying 10 weeks at the top of the chart each, way more than any other songs mentionned before. So it means once you have passed the 5 weeks at the top, you chances to stay there much longer are good.
If this observation could be generalised to more years with the help of more data, then the advice to the record companies would be the following: if one of your songs makes it to #1, then advertise it as much as you can over the following 5 week of its reaching #1. At that point, if the song is still in #1, then it has probably become so popular that it will advertise by itself thanks to very frequent broadcasting and stay there much longer.
For those curious about who were these super singles of 2000 were:
- “Maria, Maria” by Santana
- “Independant women” by Destiny’s Child
How long do songs remain in the charts, regardless of their ranking?
Now let’s look at a similar graph, but for all songs in the billboard: how long do they stay in the billboard?
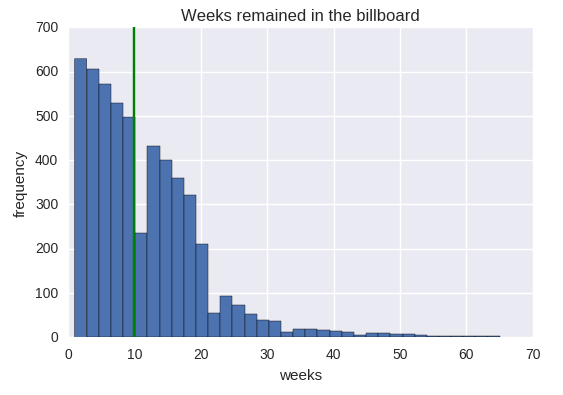
We observe a slow and steady decrease of number of songs until week 20, at which point there is a sudden drop. If this observation could be generalised to more years thanks to more data, maybe it would be linked to the fact that 20 weeks is a threshold after which listners get “tired” of a song. If a song hasn’t made a breakthrough during that time, then it is less likely to happen after 20 weeks, unless exceptional circumstances.
How long goes it take for a song to reach its peak ranking?
The graph below shows how many weeks it took for songs to reach their peak position in the billboard, regarless of which was this peak. The green bar shows the median, i.e. the number of weeks for which there are as many songs that took less time to reach their peak than there are songs that took more time.

The median, as well as most frequent value is 7 weeks.
Back to advertising, it means efforts should be concentrated on the first two months of entering the charts, roughly. After this period popularity typically declines.
Other considerations and next steps
The principal limitation of this study is that it is limited to a single year of data. Therefore any finding can be easily challenged as it does not necessarily represent a trend that holds true year after year.
Ideally, a next step would be to obtain similar data since the billboard was established in 1958 until today, and analyse evolution of the results above across the years.
From my quick observation of the billboard hot 100, there seems to be a trend over the year for singles to get longer. For instance in the sixties a single was typically 2 to 3 minutes long, whereas nowadays it lasts rather 3 to 4:30 minutes. Also it feels to me like in the past, songs reaching #1 used to stay longer there than in the recent years, where the turnover seems higher at the top of the chart.